
Data Science Interview Questions and Answers (Updating)
Published:
I hope this article could help beginners better understanding of Data Science, and have a better performance in your first interviews.
I will do a long update, and please feel free to contact me if you have any questions.
I’m just a porter, most of them are borrowing from others.
Data Science Questions and Answers for beginner
Editor : Zhiqiang ZHONG
Content
Q1 How would you create a taxonomy to identify key customer trends in unstructured data?
The best way to approach this question is to mention that it is good to check with the business owner
and understand their objectives before categorizing the data. Having done this, it is always good to
follow an iterative approach by pulling new data samples and improving   the model accordingly by validating
it for accuracy by soliciting feedback from the stakeholders of the business. This helps ensure that your
model is producing actionable results and improving over the time.
Q2 Python or R – Which one would you prefer for text analytics?
The best possible answer for this would be Python because it has Pandas library that provides easy to use
data structures and high performance data analysis tools.
Q3 Which technique is used to predict categorical responses?
Classification technique is used widely in mining for classifying data sets.
Q4 What is logistic regression? Or State an example when you have used logistic regression recently.
Logistic Regression often referred as logit model is a technique to predict the binary outcome from a linear
combination of predictor variables. For example, if you want to predict whether a particular political leader
will win the election or not. In this case, the outcome of prediction is binary i.e. 0 or 1 (Win/Lose). The
predictor variables here would be the amount of money spent for election campaigning of a particular candidate,
the amount of time spent in campaigning, etc.
Q5 What are Recommender Systems?
A subclass of information filtering systems that are meant to predict the preferences or ratings that a user
would give to a product. Recommender systems are widely used in movies, news, research articles, products,
social tags, music, etc.
Q6 Why data cleaning plays a vital role in analysis?
Cleaning data from multiple sources to transform it into a format that data analysts or data scientists can work
with is a cumbersome process because - as the number of data sources increases, the time take to clean the data
increases exponentially due to the number of sources and the volume of data generated in these sources. It might
take up to 80% of the time for just cleaning data making it a critical part of analysis task.
Q7 Differentiate between univariate, bivariate and multivariate analysis.
These are descriptive statistical analysis techniques which can be differentiated based on the number of
variables involved at a given point of time. For example, the pie charts of sales based on territory involve
only one variable and can be referred to as univariate analysis.

If the analysis attempts to understand the difference between 2 variables at time as in a scatterplot, then it
is referred to as bivariate analysis. For example, analysing the volume of sale and a spending can be considered
as an example of bivariate analysis.

Analysis that deals with the study of more than two variables to understand the effect of variables on the
responses is referred to as multivariate analysis.
Q8 What do you understand by the term Normal Distribution?
Data is usually distributed in different ways with a bias to the left or to the right or it can all be jumbled
up. However, there are chances that data is distributed around a central value without any bias to the left or
right and reaches normal distribution in the form of a bell shaped curve. The random variables are distributed
in the form of an symmetrical bell shaped curve.
/Bell+Shaped+Curve+for+Normal+Distribution.jpg)
Q9 What is Linear Regression?
Linear regression is a statistical technique where the score of a variable Y is predicted from the score of a
second variable X. X is referred to as the predictor variable and Y as the criterion variable.
Q10 What is Interpolation and Extrapolation?
Estimating a value from 2 known values from a list of values is Interpolation. Extrapolation is approximating
a value by extending a known set of values or facts.
Q11 What is power analysis?
An experimental design technique for determining the effect of a given sample size.
Q12 What is K-means? How can you select K for K-means?
K-means is a clestering algorithm, handle with un-supervised problem. k-means clustering aims to partition n observations into k clusters in which each observation belongs to the cluster with the nearest mean, serving as a prototype of the cluster.
You can choose the number of cluster by visually but there is lots of ambiguity, or computethe sum of SSE(the
sum of squared error) for some values of K. To find one good K.

In this case, k=6 is the value.
Q13 What is Collaborative filtering?
The process of filtering used by most of the recommender systems to find patterns or information by collaborating
viewpoints, various data sources and multiple agents.
Q14 What is the difference between Cluster and Systematic Sampling?
Cluster sampling is a technique used when it becomes difficult to study the target population spread across
a wide area and simple random sampling cannot be applied. Cluster Sample is a probability sample where each
sampling unit is a collection, or cluster of elements. Systematic sampling is a statistical technique where
elements are selected from an ordered sampling frame. In systematic sampling, the list is progressed in a
circular manner so once you reach the end of the list,it is progressed from the top again. The best example
for systematic sampling is equal probability method.
Q15 Are expected value and mean value different?
They are not different but the terms are used in different contexts. Mean is generally referred when talking
about a probability distribution or sample population whereas expected value is generally referred in a
random variable context.

***For Sampling Data***
Mean value is the only value that comes from the sampling data.
Expected Value is the mean of all the means i.e. the value that is built from multiple samples. Expected
value is the population mean.

***For Distributions***
Mean value and Expected value are same irrespective of the distribution, under the condition that the
distribution is in the same population.
Q16 What does P-value signify about the statistical data?
P-value is used to determine the significance of results after a hypothesis test in statistics. P-value
helps the readers to draw conclusions and is always between 0 and 1. - P- Value > 0.05 denotes weak evidence against the null hypothesis which means the null hypothesis cannot be rejected. - P-value <= 0.05 denotes strong evidence against the null hypothesis which means the null hypothesis can be rejected. - P-value=0.05is the marginal value indicating it is possible to go either way.
Q17 Do gradient descent methods always converge to same point?
No, they do not because in some cases it reaches a local minima or a local optima point. You don’t reach
the global optima point. It depends on the data and starting conditions
#### Q18 What are categorical variables?
Q19 A test has a true positive rate of 100% and false positive rate of 5%. There is a population with a 1/1000 rate of having the condition the test identifies. Considering a positive test, what is the probability of having that condition?
Let’s suppose you are being tested for a disease, if you have the illness the test will end up saying you
have the illness. However, if you don’t have the illness- 5% of the times the test will end up saying you
have the illness and 95% of the times the test will give accurate result that you don’t have the illness.
Thus there is a 5% error in case you do not have the illness.

Out of 1000 people, 1 person who has the disease will get true positive result.

Out of the remaining 999 people, 5% will also get true positive result.

Close to 50 people will get a true positive result for the disease.

This means that out of 1000 people, 51 people will be tested positive for the disease even though only one
person has the illness. There is only a 2% probability of you having the disease even if your reports say
that you have the disease.
Q20 How you can make data normal using Box-Cox transformation?
The calculation fomula of Box-Cox: 
It change the calculation between log, sqrt and reciprocal operation by changing lambda. Find a suitable lambda based on specific data set.
Q21 What is the difference between Supervised Learning an Unsupervised Learning?
If an algorithm learns something from the training data so that the knowledge can be applied to the test data,
then it is referred to as Supervised Learning. Classification is an example for Supervised Learning. If the
algorithm does not learn anything beforehand because there is no response variable or any training data,
then it is referred to as unsupervised learning. Clustering is an example for unsupervised learning.
Q22 Explain the use of Combinatorics in data science.
Combinatorics used a lot in data science, from feature engineer to algorithms(ensemble algorithms).Creat new features by merge original feature and merge several networks in one to creat news, like bagging, boosting and stacking.
Q23 Why is vectorization considered a powerful method for optimizing numerical code?
Vectorization can change original data to be structed.
Q24 What is the goal of A/B Testing?
It is a statistical hypothesis testing for randomized experiment with two variables A and B. The goal of A/B
Testing is to identify any changes to the web page to maximize or increase the outcome of an interest. An
example for this could be identifying the click through rate for a banner ad.
Q25 What is an Eigenvalue and Eigenvector?
Eigenvectors are used for understanding linear transformations. In data analysis, we usually calculate the
eigenvectors for a correlation or covariance matrix. Eigenvectors are the directions along which a particular
linear transformation acts by flipping, compressing or stretching. Eigenvalue can be referred to as the strength
of the transformation in the direction of eigenvector or the factor by which the compression occurs. #### Q26 What is Gradient Descent?
A method to find the local minimum of a function. From a point along the direction of gradient to iterational search by a certain step length, until gradient equals zero.
Q27 How can outlier values be treated?
Outlier values can be identified by using univariate or any other graphical analysis method. If the number of
outlier values is few then they can be assessed individually but for large number of outliers the values can
be substituted with either the 99th or the 1st percentile values. All extreme values are not outlier values.
The most common ways to treat outlier values –
To change the value and bring in within a range
To just remove the value.
Q28 How can you assess a good logistic model?
There are various methods to assess the results of a logistic regression analysis-
- Using Classification Matrix to look at the true negatives and false positives.
- Concordance that helps identify the ability of the logistic model to differentiate between the event happening and not happening.
- Lift helps assess the logistic model by comparing it with random selection.
Q29 What are various steps involved in an analytics project?
- Understand the business problem
- Explore the data and become familiar with it.
- Prepare the data for modelling by detecting outliers, treating missing values, transforming variables, etc.
- After data preparation, start running the model, analyse the result and tweak the approach. This is an iterative step till the best possible outcome is achieved.
- Validate the model using a new data set.
- Start implementing the model and track the result to analyse the performance of the model over the period of time.
Q30 How can you iterate over a list and also retrieve element indices at the same time?
This can be done using the enumerate function which takes every element in a sequence just like in a list
and adds its location just before it.
Q31 During analysis, how do you treat missing values?
Minsing values has many reasons, like:
- Information not advisable for this time
- Information was missed by collect
- Some attributes of some items are not avaliable
- Some information was thinked not important
- It’s too expensive to collect all these data
Types of Missing values:
- Missing completely at Random (MCAR): no relationship with missing values and other variables, like family adress
- Missing at random (MAR): not completely random, missing denpends on other variables, like finance situation data missing has relationship with the company size
- Missing not at random (MNAR): there is relationship with the value of variable self, like high income families don’t will to open its income situation
Methods treatment (you need to know clearly about your missing values firstly)
- Delect tuple Delect tuples have any missing values
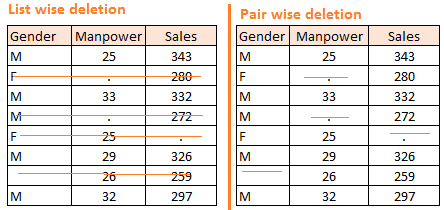
- List wise delection
- Pair wise delection
- Imputation
- Filling manually
- Treating Missing Attribute values as Special values (mean, mode, median imputation)
- Hot deck imputation
- KNN
- Assigning All Possible values of the Attribute
- Combinational Completer
- Regression
- Expectation maximization, EM
- Multiple Imputation
#### Q32 Explain about the box cox transformation in regression models.
Q33 Can you use machine learning for time series analysis?
Yes, it can be used but it depends on the applications.
Q34 Write a function that takes in two sorted lists and outputs a sorted list that is their union.
First solution which will come to your mind is to merge two lists and short them afterwards
**Python code-**
def return_union(list_a, list_b):
    return sorted(list_a + list_b)

**R code-**
return_union <- function(list_a, list_b)
{
list_c<-list(c(unlist(list_a),unlist(list_b)))
return(list(list_c[[1]][order(list_c[[1]])]))
}

Generally, the tricky part of the question is not to use any sorting or ordering function. In that
case you will have to write your own logic to answer the question and impress your interviewer.

***Python code-***
def return_union(list_a, list_b):
    len1 = len(list_a)
    len2 = len(list_b)
    final_sorted_list = []
    j = 0
    k = 0

    for i in range(len1+len2):
        if k == len1:
            final_sorted_list.extend(list_b[j:])
            break
        elif j == len2:
            final_sorted_list.extend(list_a[k:])
            break
        elif list_a[k] < list_b[j]:
            final_sorted_list.append(list_a[k])
            k += 1
        else:
            final_sorted_list.append(list_b[j])
            j += 1
    return final_sorted_list

Similar function can be returned in R as well by following the similar steps.

return_union <- function(list_a,list_b)
{
#Initializing length variables
len_a <- length(list_a)
len_b <- length(list_b)
len <- len_a + len_b

#initializing counter variables

j=1
k=1

#Creating an empty list which has length equal to sum of both the lists

list_c <- list(rep(NA,len))

#Here goes our for loop

for(i in 1:len)
{
    if(j>len_a)
    {
        list_c[i:len] <- list_b[k:len_b]
        break
    }
    else if(k>len_b)
    {
        list_c[i:len] <- list_a[j:len_a]
        break
    }
    else if(list_a[[j]] <= list_b[[k]])
    {
        list_c[[i]] <- list_a[[j]]
        j <- j+1
    }
    else if(list_a[[j]] > list_b[[k]])
    {
    list_c[[i]] <- list_b[[k]]
    k <- k+1
    }
}
return(list(unlist(list_c)))

} #### Q35 What is the difference between Bayesian Inference and Maximum Likelihood Estimation (MLE)?
Q36 What is Regularization and what kind of problems does regularization solve?
A central problem in machine learning is how to make an algorithm that will perform weel not just on
the training data, but also on new inputs. Many strategies used in machine learning are explicitly
designed to reduce the test error, possibly at the expense of increased training error. These
strategies are known collectively as regularization.
Briefly, regularization is any modification we make to a learning algorithm that is intended to
reduce its generalization error but not its training error.
Q37 What is multicollinearity and how you can overcome it?
In statistics, multicollinearity (also collinearity) is a phenomenon in which two or more predictor
variables in a multiple regression model are highly correlated, meaning that one can be linearly
predicted from the others with a substantial degree of accuracy.
Solutions:
    Remove variables that lead to multicollinearity.
    Obtain more data.
    Ridge regression or PCA (principal component regression) or partial least squares regression [More reading in WIKI](https://en.wikipedia.org/wiki/Multicollinearity)
Q38 What is the curse of dimensionality?
It refers to various phenomena that arise when analyzing and organizing data in high-dimensional
spaces (often with hundreds or thousands of dimensions) that do not occur in low-dimensional
settings.
Q39 How do you decide whether your linear regression model fits the data?
Many solutions, such as use a loss function and check it situation, or use test data to verify
our model
#### Q40 What is the difference between squared error and absolute error?
Q41 What is Machine Learning?
The simplest way to answer this question is – we give the data and equation to the machine. Ask the
machine to look at the data and identify the coefficient values in an equation.

For example for the linear regression y=mx+c, we give the data for the variable x, y and the machine
learns about the values of m and c from the data.
Q42 How are confidence intervals constructed and how will you interpret them?
Confidence interval is: under a certain confidence, the length of the area where the overall parameter is located.
Q43 How will you explain logistic regression to an economist, physican scientist and biologist?
Q44 How can you overcome Overfitting?
Regularization: add a regularizer or a penalty term.
Cross Validation: Simple cross validation; S-folder cross validation; Leave-one-out cross validation.
Q45 Differentiate between wide and tall data formats?
Wide: data formats have lots of columns.
Tall: data formats have lots of examples.
Q46 Is Naïve Bayes bad? If yes, under what aspects.
Q47 How would you develop a model to identify plagiarism?
Q48 How will you define the number of clusters in a clustering algorithm?
Though the Clustering Algorithm is not specified, this question will mostly be asked in reference to
K-Means clustering where “K” defines the number of clusters. The objective of clustering is to group
similar entities in a way that the entities within a group are similar to each other but the groups
are different from each other.

For example, the following image shows three different groups.
/Data+Science+Interview+Questions+K-Means+Clustering.jpg)
K-Mean Clustering Machine Learning Algorithm

Within Sum of squares is generally used to explain the homogeneity within a cluster. If you plot WSS
for a range of number of clusters, you will get the plot shown below. The Graph is generally known as
Elbow Curve.
/Data+Science+Interview+Questions+K-Means.png)
Red circled point in above graph i.e. Number of Cluster =6 is the point after which you don’t see any
decrement in WSS. This point is known as bending point and taken as K in K – Means.

This is the widely used approach but few data scientists also use Hierarchical clustering first to
create dendograms and identify the distinct groups from there. #### Q49 Is it better to have too many false negatives or too many false positives?
It depends on the situation, for example, if we use the model for cancer detection, FN(False Negative)
is more serious than FP(False Positive) because a FN could be verified in futher check, but
FP maybe will let a patient be missed and delay the best treatment period.
Q50 Is it possible to perform logistic regression with Microsoft Excel?
Yep, i must say Microsoft Excel is more and more powerful, and many data science could be
realized in simple way.
Q51 What do you understand by Fuzzy merging ? Which language will you use to handle it?
Q51 What is the difference between skewed and uniform distribution?
G52 You created a predictive model of a quantitative outcome variable using multiple regressions. What are the steps you would follow to validate the model?
Since the question asked, is about post model building exercise, we will assume that you have
already tested for null hypothesis, multi collinearity and Standard error of coefficients.

Once you have built the model, you should check for following – - Global F-test to see the significance of group of independent variables on dependent variable - R^2 - Adjusted R^2 - RMSE, MAPE
In addition to above mentioned quantitative metrics you should also check for-
- Residual plot
- Assumptions of linear regression
Q54 What do you understand by Hypothesis in the content of Machine Learning?
Q55 What do you understand by Recall and Precision?
Q56 How will you find the right K for K-means?
No any other way just do experiment on instance dataset, see the result of different K, find
the better one.
Q57 Why L1 regularizations causes parameter sparsity whereas L2 regularization does not?
Regularizations in statistics or in the field of machine learning is used to include some extra
information in order to solve a problem in a better way. L1 & L2 regularizations are generally used
to add constraints to optimization problems.
/L1+L2+Regularizations.png)
In the example shown above H0 is a hypothesis. If you observe, in L1 there is a high likelihood to
hit the corners as solutions while in L2, it doesn’t. So in L1 variables are penalized more as compared
to L2 which results into sparsity.
In other words, errors are squared in L2, so model sees higher error and tries to minimize that squared
error.
Q58 How can you deal with different types of seasonality in time series modelling?
Q59 In experimental design, is it necessary to do randomization? If yes, why?
Normally yes, but never do it for time series dataset.
Q60 What do you understand by conjugate-prior with respect to Naïve Bayes?
Q61 Can you cite some examples where a false positive is important than a false negative?
Before we start, let us understand what are false positives and what are false negatives.
False Positives are the cases where you wrongly classified a non-event as an event a.k.a Type I error.
And, False Negatives are the cases where you wrongly classify events as non-events, a.k.a Type II error.
/False+Positive+False+Negative.png)
In medical field, assume you have to give chemo therapy to patients. Your lab tests patients for certain
vital information and based on those results they decide to give radiation therapy to a patient.
Assume a patient comes to that hospital and he is tested positive for cancer (But he doesn’t have cancer)
based on lab prediction. What will happen to him? (Assuming Sensitivity is 1)

One more example might come from marketing. Let’s say an ecommerce company decided to give $1000 Gift
voucher to the customers whom they assume to purchase at least $5000 worth of items. They send free voucher
mail directly to 100 customers without any minimum purchase condition because they assume to make at
least 20% profit on sold items above 5K.

Now what if they have sent it to false positive cases?
Q62 Can you cite some examples where a false negative important than a false positive?
Assume there is an airport ‘A’ which has received high security threats and based on certain
characteristics they identify whether a particular passenger can be a threat or not. Due to shortage
of staff they decided to scan passenger being predicted as risk positives by their predictive model.
What will happen if a true threat customer is being flagged as non-threat by airport model?

Another example can be judicial system. What if Jury or judge decide to make a criminal go free?

What if you rejected to marry a very good person based on your predictive model and you happen to
meet him/her after few years and realize that you had a false negative?
Q63 Can you cite some examples where both false positive and false negatives are equally important?
In the banking industry giving loans is the primary source of making money but at the same time if
your repayment rate is not good you will not make any profit, rather you will risk huge losses.

Banks don’t want to lose good customers and at the same point of time they don’t want to acquire
bad customers. In this scenario both the false positives and false negatives become very important
to measure.
Q64 Can you explain the difference between a Test Set and a Validation Set?
Validation set can be considered as a part of the training set as it is used for parameter selection
and to avoid Overfitting of the model being built. On the other hand, test set is used for testing
or evaluating the performance of a trained machine leaning model.

In simple terms ,the differences can be summarized as-
- Training Set is to fit the parameters i.e. weights.
- Test Set is to assess the performance of the model i.e. evaluating the predictive power and generalization.
- Validation set is to tune the parameters.
Q65 What makes a dataset gold standard?
Q66 What do you understand by statistical power of sensitivity and how do you calculate it?
Sensitivity is commonly used to validate the accuracy of a classifier (Logistic, SVM, RF etc.).
Sensitivity is nothing but “Predicted TRUE events/ Total events”. True events here are the events
which were true and model also predicted them as true.

Calculation of seasonality is pretty straight forward-

***Seasonality = True Positives /Positives in Actual Dependent Variable***

Where, True positives are Positive events which are correctly classified as Positives.
Q67 What is the importance of having a selection bias?
Q68 Give some situations where you will use an SVM over a RandomForest Machine Learning algorithm and vice-versa.
SVM and Random Forest are both used in classification problems.

a)      If you are sure that your data is outlier free and clean then go for SVM. It is the
opposite - if your data might contain outliers then Random forest would be the best choice
b)      Generally, SVM consumes more computational power than Random Forest, so if you are constrained
with memory go for Random Forest machine learning algorithm.
c)  Random Forest gives you a very good idea of variable importance in your data, so if you want to
have variable importance then choose Random Forest machine learning algorithm.
d)      Random Forest machine learning algorithms are preferred for multiclass problems.
e)     SVM is preferred in multi-dimensional problem set - like text classification
but as a good data scientist, you should experiment with both of them and test for accuracy or rather
you can use ensemble of many Machine Learning techniques.
Q69 What do you understand by feature vectors?
#### Q70 How do data management procedures like missing data handling make selection bias worse?
Q71 What are the advantages and disadvantages of using regularization methods like Ridge Regression?
#### Q72 What do you understand by long and wide data formats?
Q73 What do you understand by outliers and inliers? What would you do if you find them in your dataset?
~~#### Q74 Write a program in Python which takes input as the diameter of a coin and weight of the coin and produces output as the money value of the coin.
Q75 What are the basic assumptions to be made for linear regression?
Normality of error distribution, statistical independence of errors, linearity and additivity.
Q76 Can you write the formula to calculat R-square?
R-Square can be calculated using the below formular -
1 - (Residual Sum of Squares/ Total Sum of Squares)
Q77 What is the advantage of performing dimensionality reduction before fitting an SVM?
Support Vector Machine Learning Algorithm performs better in the reduced space. It is beneficial to
perform dimensionality reduction before fitting an SVM if the number of features is large when
compared to the number of observations.
Q78 How will you assess the statistical significance of an insight whether it is a real insight or just by chance?
Statistical importance of an insight can be accessed using Hypothesis Testing.
Machine Learning Interview Questions: Algorithms/Theory
Q79 What’s the trade-off between bias and variance?
Bias is error due to erroneous or overly simplistic assumptions in the learning algorithm
you’re using. This can lead to the model underfitting your data, making it hard for it to have
high predictive accuracy and for you to generalize your knowledge from the training set to the
test set.

Variance is error due to too much complexity in the learning algorithm you’re using. This leads
to the algorithm being highly sensitive to high degrees of variation in your training data, which
can lead your model to overfit the data. You’ll be carrying too much noise from your training data
for your model to be very useful for your test data.

The bias-variance decomposition essentially decomposes the learning error from any algorithm by
adding the bias, the variance and a bit of irreducible error due to noise in the underlying dataset.
Essentially, if you make the model more complex and add more variables, you’ll lose bias but gain
some variance — in order to get the optimally reduced amount of error, you’ll have to tradeoff bias
and variance. You don’t want either high bias or high variance in your model.
Q80 What is the difference between supervised and unsupervised machine learning?
Supervised learning requires training labeled data. For example, in order to do classification
(a supervised learning task), you’ll need to first label the data you’ll use to train the model
to classify data into your labeled groups. Unsupervised learning, in contrast, does not require
labeling data explicitly.
Q81 How is KNN different from k-means clustering?
K-Nearest Neighbors is a supervised classification algorithm, while k-means clustering is an
unsupervised clustering algorithm. While the mechanisms may seem similar at first, what this
really means is that in order for K-Nearest Neighbors to work, you need labeled data you want to
classify an unlabeled point into (thus the nearest neighbor part). K-means clustering requires only
a set of unlabeled points and a threshold: the algorithm will take unlabeled points and gradually
learn how to cluster them into groups by computing the mean of the distance between different points.

The critical difference here is that KNN needs labeled points and is thus supervised learning, while
k-means doesn’t — and is thus unsupervised learning.
Q82 Explain how a ROC curve works.
The ROC curve is a graphical representation of the contrast between true positive rates and the
false positive rate at various thresholds. It’s often used as a proxy for the trade-off between
the sensitivity of the model (true positives) vs the fall-out or the probability it will trigger
a false alarm (false positives).

Q83 Define precision and recall.
Recall is also known as the true positive rate: the amount of positives your model claims
compared to the actual number of positives there are throughout the data. Precision is also
known as the positive predictive value, and it is a measure of the amount of accurate positives
your model claims compared to the number of positives it actually claims. It can be easier to think
of recall and precision in the context of a case where you’ve predicted that there were 10 apples
and 5 oranges in a case of 10 apples. You’d have perfect recall (there are actually 10 apples, and
you predicted there would be 10) but 66.7% precision because out of the 15 events you predicted,
only 10 (the apples) are correct.
Q84 What is Bayes’ Theorem? How is it useful in a machine learning context?
Bayes’ Theorem gives you the posterior probability of an event given what is known as prior knowledge.

Mathematically, it’s expressed as the true positive rate of a condition sample divided by the sum of
the false positive rate of the population and the true positive rate of a condition. Say you had a
60% chance of actually having the flu after a flu test, but out of people who had the flu, the test
will be false 50% of the time, and the overall population only has a 5% chance of having the flu.
Would you actually have a 60% chance of having the flu after having a positive test?

Bayes’ Theorem says no. It says that you have a (.6 * 0.05) (True Positive Rate of a Condition
Sample) / (.6*0.05)(True Positive Rate of a Condition Sample) + (.5*0.95) (False Positive Rate of
a Population)  = 0.0594 or 5.94% chance of getting a flu.

Bayes’ Theorem is the basis behind a branch of machine learning that most notably includes the
Naive Bayes classifier. That’s something important to consider when you’re faced with machine
learning interview questions.
Q85 Why is “Naive” Bayes naive?
Despite its practical applications, especially in text mining, Naive Bayes is considered “Naive”
because it makes an assumption that is virtually impossible to see in real-life data: the
conditional probability is calculated as the pure product of the individual probabilities of
components. This implies the absolute independence of features — a condition probably never met
in real life.

As a Quora commenter put it whimsically, a Naive Bayes classifier that figured out that you liked
pickles and ice cream would probably naively recommend you a pickle ice cream.
Q86 Explain the difference between L1 and L2 regularization.
L2 regularization tends to spread error among all the terms, while L1 is more binary/sparse, with
many variables either being assigned a 1 or 0 in weighting. L1 corresponds to setting a Laplacean
prior on the terms, while L2 corresponds to a Gaussian prior.

Q87 What’s your favorite algorithm, and can you explain it to me in less than a minute?
This type of question tests your understanding of how to communicate complex and technical nuances
with poise and the ability to summarize quickly and efficiently. Make sure you have a choice and
make sure you can explain different algorithms so simply and effectively that a five-year-old could
grasp the basics!
Q88 What’s the difference between Type I and Type II error?
Don’t think that this is a trick question! Many machine learning interview questions will be an
attempt to lob basic questions at you just to make sure you’re on top of your game and you’ve
prepared all of your bases.

Type I error is a false positive, while Type II error is a false negative. Briefly stated, Type I
error means claiming something has happened when it hasn’t, while Type II error means that you claim
nothing is happening when in fact something is.

A clever way to think about this is to think of Type I error as telling a man he is pregnant, while
Type II error means you tell a pregnant woman she isn’t carrying a baby.
Q89 What’s a Fourier transform?
A Fourier transform is a generic method to decompose generic functions into a superposition of symmetric
functions. Or as this more intuitive tutorial puts it, given a smoothie, it’s how we find the recipe. The
Fourier transform finds the set of cycle speeds, amplitudes and phases to match any time signal. A Fourier
transform converts a signal from time to frequency domain — it’s a very common way to extract features from
audio signals or other time series such as sensor data.
Q90 What’s the difference between probability and likelihood?

Q91 What is deep learning, and how does it contrast with other machine learning algorithms?
Deep learning is a subset of machine learning that is concerned with neural networks: how to use
backpropagation and certain principles from neuroscience to more accurately model large sets of
unlabelled or semi-structured data. In that sense, deep learning represents an unsupervised learning
algorithm that learns representations of data through the use of neural nets.
Q92 What’s the difference between a generative and discriminative model?
A generative model will learn categories of data while a discriminative model will simply learn the
distinction between different categories of data. Discriminative models will generally outperform
generative models on classification tasks.
Q93 What cross-validation technique would you use on a time series dataset?
Instead of using standard k-folds cross-validation, you have to pay attention to the fact that a
time series is not randomly distributed data — it is inherently ordered by chronological order. If a
pattern emerges in later time periods for example, your model may still pick up on it even if that
effect doesn’t hold in earlier years!

You’ll want to do something like forward chaining where you’ll be able to model on past data then
look at forward-facing data.

fold 1 : training [1], test [2]
fold 2 : training [1 2], test [3]
fold 3 : training [1 2 3], test [4]
fold 4 : training [1 2 3 4], test [5]
fold 5 : training [1 2 3 4 5], test [6] #### Q94 How is a decision tree pruned?

Pruning is what happens in decision trees when branches that have weak predictive power are removed
in order to reduce the complexity of the model and increase the predictive accuracy of a decision
tree model. Pruning can happen bottom-up and top-down, with approaches such as reduced error pruning
and cost complexity pruning.

Reduced error pruning is perhaps the simplest version: replace each node. If it doesn’t decrease
predictive accuracy, keep it pruned. While simple, this heuristic actually comes pretty close to an
approach that would optimize for maximum accuracy.
Q95 Which is more important to you– model accuracy, or model performance?
This question tests your grasp of the nuances of machine learning model performance! Machine learning
interview questions often look towards the details. There are models with higher accuracy that can
perform worse in predictive power — how does that make sense?

Well, it has everything to do with how model accuracy is only a subset of model performance, and at
that, a sometimes misleading one. For example, if you wanted to detect fraud in a massive dataset with
a sample of millions, a more accurate model would most likely predict no fraud at all if only a vast
minority of cases were fraud. However, this would be useless for a predictive model — a model designed
to find fraud that asserted there was no fraud at all! Questions like this help you demonstrate that
you understand model accuracy isn’t the be-all and end-all of model performance.
Q96 What’s the F1 score? How would you use it?
The F1 score is a measure of a model’s performance. It is a weighted average of the precision and recall
of a model, with results tending to 1 being the best, and those tending to 0 being the worst. You would
use it in classification tests where true negatives don’t matter much.
Q97 How would you handle an imbalanced dataset?
An imbalanced dataset is when you have, for example, a classification test and 90% of the data is in one
class. That leads to problems: an accuracy of 90% can be skewed if you have no predictive power on the
other category of data! Here are a few tactics to get over the hump:

1- Collect more data to even the imbalances in the dataset.

2- Resample the dataset to correct for imbalances.

3- Try a different algorithm altogether on your dataset.

What’s important here is that you have a keen sense for what damage an unbalanced dataset can cause,
and how to balance that.
Q98 When should you use classification over regression?
Classification produces discrete values and dataset to strict categories, while regression gives you
continuous results that allow you to better distinguish differences between individual points. You would
use classification over regression if you wanted your results to reflect the belongingness of data points
in your dataset to certain explicit categories (ex: If you wanted to know whether a name was male or
female rather than just how correlated they were with male and female names.)
Q99 Name an example where ensemble techniques might be useful.
Ensemble techniques use a combination of learning algorithms to optimize better predictive performance.
They typically reduce overfitting in models and make the model more robust (unlikely to be influenced by
small changes in the training data).

You could list some examples of ensemble methods, from bagging to boosting to a “bucket of models” method
and demonstrate how they could increase predictive power.
Q100 How do you ensure you’re not overfitting with a model?
This is a simple restatement of a fundamental problem in machine learning: the possibility of
overfitting training data and carrying the noise of that data through to the test set, thereby
providing inaccurate generalizations.

There are three main methods to avoid overfitting:

1- Keep the model simpler: reduce variance by taking into account fewer variables and parameters,
thereby removing some of the noise in the training data.

2- Use cross-validation techniques such as k-folds cross-validation.

3- Use regularization techniques such as LASSO that penalize certain model parameters if they’re
likely to cause overfitting.
Q101 What evaluation approaches would you work to gauge the effectiveness of a machine learning model?
You would first split the dataset into training and test sets, or perhaps use cross-validation
techniques to further segment the dataset into composite sets of training and test sets within
the data. You should then implement a choice selection of performance metrics: here is a fairly
comprehensive list. You could use measures such as the F1 score, the accuracy, and the confusion
matrix. What’s important here is to demonstrate that you understand the nuances of how a model is
measured and how to choose the right performance measures for the right situations.
Q102 How would you evaluate a logistic regression model?
A subsection of the question above. You have to demonstrate an understanding of what the typical goals
of a logistic regression are (classification, prediction etc.) and bring up a few examples and use cases.
Q103 What’s the “kernel trick” and how is it useful?
The Kernel trick involves kernel functions that can enable in higher-dimension spaces without explicitly
calculating the coordinates of points within that dimension: instead, kernel functions compute the inner
products between the images of all pairs of data in a feature space. This allows them the very useful
attribute of calculating the coordinates of higher dimensions while being computationally cheaper than
the explicit calculation of said coordinates. Many algorithms can be expressed in terms of inner products.
Using the kernel trick enables us effectively run  algorithms in a high-dimensional space with lower-dimensional data.
Machine Learning Interview Questions: Programming
These machine learning interview questions test your knowledge of programming principles you need to implement machine learning principles in practice. Machine learning interview questions tend to be technical questions that test your logic and programming skills: this section focuses more on the latter.
#### Q104 How do you handle missing or corrupted data in a dataset?
Q105 Do you have experience with Spark or big data tools for machine learning?
You’ll want to get familiar with the meaning of big data for different companies and the different
tools they’ll want. Spark is the big data tool most in demand now, able to handle immense datasets
with speed. Be honest if you don’t have experience with the tools demanded, but also take a look at
job descriptions and see what tools pop up: you’ll want to invest in familiarizing yourself with them.
Q106 Pick an algorithm. Write the psuedo-code for a parallel implementation.
This kind of question demonstrates your ability to think in parallelism and how you could handle
concurrency in programming implementations dealing with big data. Take a look at pseudocode frameworks
such as Peril-L and visualization tools such as Web Sequence Diagrams to help you demonstrate your
ability to write code that reflects parallelism.
Q107 What are some differences between a linked list and an array?
An array is an ordered collection of objects. A linked list is a series of objects with pointers that
direct how to process them sequentially. An array assumes that every element has the same size, unlike
the linked list. A linked list can more easily grow organically: an array has to be pre-defined or
re-defined for organic growth. Shuffling a linked list involves changing which points direct where —
meanwhile, shuffling an array is more complex and takes more memory.
Q108 Describe a hash table.
A hash table is a data structure that produces an associative array. A key is mapped to certain values
through the use of a hash function. They are often used for tasks such as database indexing.
Q109 Which data visualization libraries do you use? What are your thoughts on the best data visualization tools?
What’s important here is to define your views on how to properly visualize data and your personal
preferences when it comes to tools. Popular tools include R’s ggplot, Python’s seaborn and matplotlib,
and tools such as Plot.ly and Tableau.

Machine Learning Interview Questions: Company/Industry Specific
These machine learning interview questions deal with how to implement your general machine learning knowledge to a specific company’s requirements. You’ll be asked to create case studies and extend your knowledge of the company and industry you’re applying for with your machine learning skills.
Q110 How would you implement a recommendation system for our company’s users?
A lot of machine learning interview questions of this type will involve implementation of machine learning
models to a company’s problems. You’ll have to research the company and its industry in-depth, especially
the revenue drivers the company has, and the types of users the company takes on in the context of the
industry it’s in.
Q111 How can we use your machine learning skills to generate revenue?
This is a tricky question. The ideal answer would demonstrate knowledge of what drives the business and
how your skills could relate. For example, if you were interviewing for music-streaming startup Spotify,
you could remark that your skills at developing a better recommendation model would increase user retention,
which would then increase revenue in the long run.

The startup metrics Slideshare linked above will help you understand exactly what performance indicators
are important for startups and tech companies as they think about revenue and growth.
Q112 What do you think of our current data process?
This kind of question requires you to listen carefully and impart feedback in a manner that is constructive
and insightful. Your interviewer is trying to gauge if you’d be a valuable member of their team and whether
you grasp the nuances of why certain things are set the way they are in the company’s data process based on
company- or industry-specific conditions. They’re trying to see if you can be an intellectual peer. Act
accordingly.
Machine Learning Interview Questions: General Machine Learning Interest
This series of machine learning interview questions attempts to gauge your passion and interest in machine learning. The right answers will serve as a testament for your commitment to being a lifelong learner in machine learning.
Q113 What are the last machine learning papers you’ve read?
Keeping up with the latest scientific literature on machine learning is a must if you want to demonstrate
interest in a machine learning position. This overview of deep learning in Nature by the scions of deep
learning themselves (from Hinton to Bengio to LeCun) can be a good reference paper and an overview of what’s
happening in deep learning — and the kind of paper you might want to cite.
Q114 Do you have research experience in machine learning?
Related to the last point, most organizations hiring for machine learning positions will look for your
formal experience in the field. Research papers, co-authored or supervised by leaders in the field, can make
the difference between you being hired and not. Make sure you have a summary of your research experience
and papers ready — and an explanation for your background and lack of formal research experience if you don’t.
Q115 What are your favorite use cases of machine learning models?
The Quora thread above contains some examples, such as decision trees that categorize people into different
tiers of intelligence based on IQ scores. Make sure that you have a few examples in mind and describe what
resonated with you. It’s important that you demonstrate an interest in how machine learning is implemented.
Q116 How would you approach the “Netflix Prize” competition?
The Netflix Prize was a famed competition where Netflix offered $1,000,000 for a better collaborative
filtering algorithm. The team that won called BellKor had a 10% improvement and used an ensemble of different
methods to win. Some familiarity with the case and its solution will help demonstrate you’ve paid attention
to machine learning for a while.
Q117 Where do you usually source datasets?
Machine learning interview questions like these try to get at the heart of your machine learning interest.
Somebody who is truly passionate about machine learning will have gone off and done side projects on their own,
and have a good idea of what great datasets are out there. If you’re missing any, check out Quandl for economic
and financial data, and Kaggle’s Datasets collection for another great list.
Q118 How do you think Google is training data for self-driving cars?
Machine learning interview questions like this one really test your knowledge of different machine learning
methods, and your inventiveness if you don’t know the answer. Google is currently using recaptcha to source
labelled data on storefronts and traffic signs. They are also building on training data collected by Sebastian
Thrun at GoogleX — some of which was obtained by his grad students driving buggies on desert dunes!
Q119 How would you simulate the approach AlphaGo took to beat Lee Sidol at Go?
AlphaGo beating Lee Sidol, the best human player at Go, in a best-of-five series was a truly seminal event
in the history of machine learning and deep learning. The Nature paper above describes how this was accomplished
with “Monte-Carlo tree search with deep neural networks that have been trained by supervised learning,
from human expert games, and by reinforcement learning from games of self-play.”
Reference: Deep Learning (Ian Goodfellow, Yoshua Bengio and Aaron Courville) – MIT